Assessment of local water quality and quantity and infrastructure in Kanpur and New Delhi
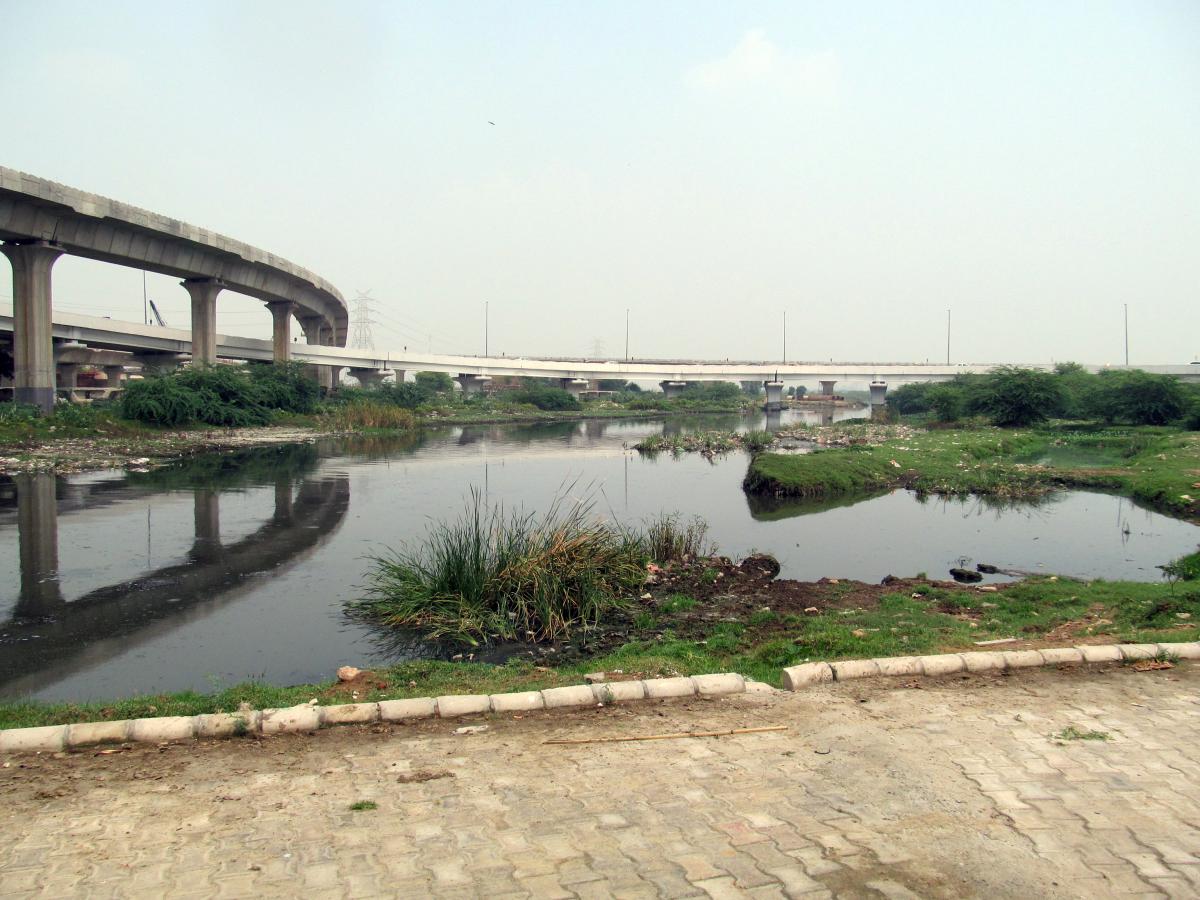
The Barapullah Drain in New Delhi
The Barapullah Drain catchment is situated on the western bank of the river Yamuna and is spread over five sub-districts of Delhi. The Barapullah catchment is 376 km2 with a population of approximately 3.5 million as of the 2011 census. The catchment is completely urbanized. The Barapullah, the major drain in the catchment (also referred to as Nizammuddin Darya), is a major stormwater drain. Due to limitations in urban sewage treatment infrastructure, the Barapullah currently discharges approximately 1.25 million litres (330 MGD) of wastewater per day into the Yamuna river, accounting for 80% of the stormwater which is transported to the Yamuna from the region. The drain is approximately 100m wide at the outlet to the Yamuna and is 16km long.
The treatment capacity exists for treating nearly 53% of the total 330 MGD of wastewater generated in the Barapullah catchment area. A significant portion of untreated wastewater goes directly into the river.
Domestic sources account for approximately 85% of pollution to the Yamuna River and include debris, untreated sewage and industrial effluents (Malik et al., 2014). Consequently, the outflow has high concentration of heavy metals [including lead (Pb), zinc (Zn), and copper (Cu)], high biochemical oxygen demand (BOD) and low values of dissolved oxygen (DO), which have historically not conformed to the recommended levels. More recent studies have highlighted the emergence of antibiotic resistant bacteria (ARB) originating from untreated sewage in the Yamuna River (Lamba et al.,2017).
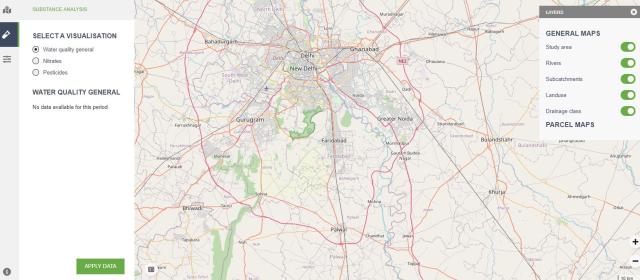
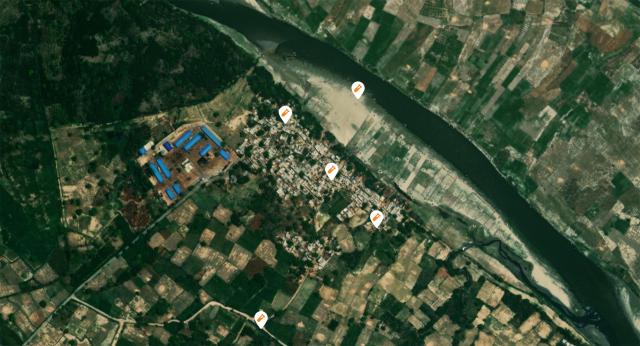
The monitoring data collected through the citizen science baseline survey, using hand held devices, provided insights into the prevailing water quality from selected points. Thirteen water samples (2 handpumps and 11 borewells) were tested during the first round of monitoring in “upstream” / “mid-stream” / “downstream” areas. In the second round of monitoring, we sampled nine of these water sources. Along with water quality tests, data was collected on general Information about the usage and functionality of the sampled water sources, and the perceptions and exposures to health risks.
Kanpur Metropolitan Area
Kanpur Metropolitan Area is located in the State of Uttar Pradesh and is the 10th most populous city in India with over 3 million people. The region is one of the major urban and industrial centers along the Ganges. Over the past 50 years, Kanpur has grown geographically by only four sq. km. However, the population has increased by more than three times from a mere 0.96 million in 1981 to 2.9 million in 2011. As a consequence, population density has increased from 3,243 persons/sq. km in 1961 to 9,666 persons/sq. km in 2011, thus putting more pressure on the existing natural resources in the city. Domestic water demand is estimated at 600 million liters per day (MLD). However, only 385 MLD is delivered to wastewater treatment plants due to infrastructure limitations.
The estimated sewage generation in Kanpur city is about 339 MLD but only 50% is treated. Apart from the use of a small quantity of treated wastewater in irrigation, the rest of the treated wastewater and the untreated wastewater is directly drained into the river Ganga in the north and at the river Pandu in the south of Kanpur city. Sismau and Permiya Nalas (open drains) contribute to about 50 percent of total wastewater which is discharged into the River Ganga and River Pandu.
The monitoring data collected through the citizen science baseline survey in Kanpur provided insights into the water quality and management challenges in the selected villages receiving partially treated wastewater for irrigation. In the irrigation scheme area, six villages (Motipur, Trilokpur, Pewandi, Alalualpur, Kulgaon and Kishanpur) were selected for monitoring, which received irrigation water through concrete line canals or unlined canals. In total 30 samples were collected from the six villages. In each village, five groundwater sources were monitored from submersible pumps or handpumps. Along with water quality tests, data was collected on general Information about the village, usage and functionality of the sampled water sources and the perceptions and exposures to health risks.

Main challenges
The water management issues in the two areas reflect the general situation in India, whereby the current infrastructure is unable to deal with the waste generated by the growing population and industrial developments.
An important difference between the two areas is that New Delhi meets about 50% of its water needs (913 million gallons per day (MGD) in 2018) from water imports, whereas Kanpur uses water from the River Ganga and the local groundwater resources. Therefore, dealing with the pollution of surface water and groundwater bodies remains a management priority for the local self-governing bodies of both urban areas.
Conclusions
In both Delhi and Kanpur, the pH concentrations of the sampled water sources generally remained within the permissible limits for drinking. However, occasional deviations, particularly towards acidity, emphasize the need for continued monitoring and potential remediation measures. Electrical Conductivity (EC) readings across the monitored sources were consistently within acceptable limits, indicating overall compliance with acceptable standards.
Notably, instances of elevated nitrate concentrations in specific water sources were observed during the initial monitoring round in May 2023, particularly in Delhi. However, subsequent rounds showed a reduction in nitrate levels. Understanding the varied usage of water sources, such as for bathing and cleaning purposes rather than drinking, is crucial for appropriate interpretation and future deliberation. The variation in nitrate levels between monitoring rounds highlights the dynamic nature of water quality and underscores the importance of continuous monitoring to capture temporal fluctuations.
The results also point out the significance of considering the specific functions of water sources, as certain locations may be more prone to contamination due to their usage patterns or other reasons that could not be captured in detail during the baseline data collection. In the Kanpur irrigation scheme, the water quality was poorer in samples taken from villages with concrete, than in villages with unlined irrigation canals.
The monitoring results emphasize the need for sustained efforts in water quality management, community engagement, and continuous capacity building. It demonstrates a promising model for empowering non-experts to contribute to water management initiatives and understand water challenges in diverse communities, laying the foundation for informed decision-making and targeted interventions.
Read the entire deliverable report*:
Benchmark assessment of local water quality and quantity and existing infrastructures in the two case areas
* The deliverable report is still under review and has not yet been approved by the European Commission. The final approved version will be uploaded as soon as possible.
The conclusions of the modelling work can also be read in an interview article with Dr. Dinesh Kumar from IRAP and are presented in the Pavitra Ganga Dashboard.
Read the research article 'Market instruments and institutions for reducing pollution in the Ganga River Basin' published in 'Water Policy', the official journal of the World Water Council.